

FARE Patient Registry Data Paints Picture of Living With Food Allergy
Visually explore the impact food allergy has had on the 11,000+ members of the FARE Patient Registry.
Since its launch in May 2017, the FARE Patient Registry (FAREregistry.org) has increased in scope and value. The Registry houses the food allergy stories of more than 11,000 people, recorded through surveys that Registry members complete online at their convenience. Each member’s story contributes to our understanding of the disease and its impacts, revealing opportunities to expand research and tailor services to the needs of our community.
The data shared by FARE Patient Registry members paint a picture of what it’s like to live with food allergies. One publicly accessible way to see parts of this picture is the FARE Patient Registry’s Data Highlights page. There you can find infographics that illustrate the breadth of food allergy experiences reported by Registry members:*
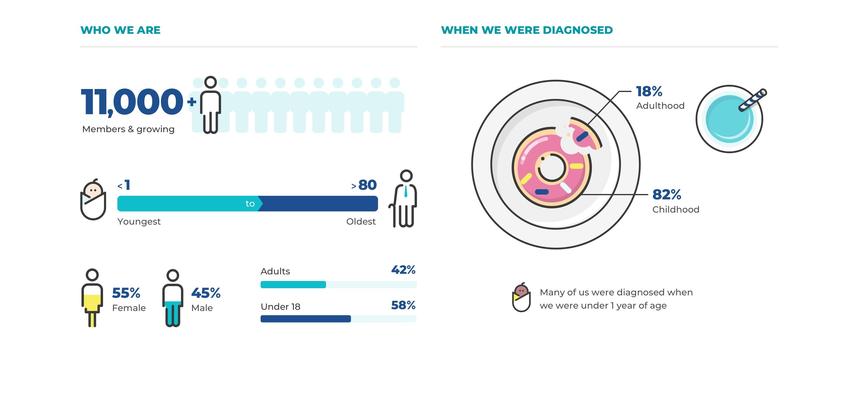
- The Registry community ranges in age from infancy to seniors well past 80 years.
- Although most Registry members are children or teenagers, nearly 20 percent were diagnosed for the first time as adults.
- Members of the community report allergies to a total of more than 200 foods.
- The most commonly reported allergen, peanuts, affects two-thirds of Registry members.
- Only one in five Registry members is allergic to a single food, highlighting the pressing need for effective multi-allergen treatments.
- About 60 percent have had at least one reaction that required emergency care.
- Nearly half of Registry members have eczema, and a similar percentage have asthma.
There’s also a second way that Registry members can see their own their food allergy stories in a new context. Once you join the FARE Patient Registry and take the surveys, you will be able to compare all of your survey answers to those provided by the FARE Patient Registry community. The Registry’s View Data function graphs responses to each survey question in real time, highlighting your answer within the data reported by the whole community. And each story shared with the Registry adds valuable details that can help researchers uncover hidden patterns and search for solutions.
Want to see more? Visit the FARE Patient Registry to explore, share your story, and look at life with food allergies in two new ways.
*Data are from April 2020